Meta description: Learn how to read stock market charts in a simple, visual, and beginner-friendly way. Discover key terms, patterns, and tools to become a more confident investor.
Understanding stock market charts is one of the most valuable skills for anyone who wants to invest wisely. These charts tell the story of how a stock has performed over time and help you make better decisions when buying or selling. But if you’re new to investing, these graphs might look like a confusing mix of lines, numbers, and symbols.
Don’t worry — this guide will simplify everything.
Let’s break down how to read stock charts so you can navigate the market with more confidence and strategy.
Why Stock Charts Matter
Stock charts help you:
- Visualize how a stock’s price has changed over time.
- Identify trends, patterns, and potential turning points.
- Make smarter buying or selling decisions based on past performance.
Whether you’re a beginner investor or someone trying to understand more about how the stock market works, learning to read charts is essential.
Key Elements of a Stock Chart
1. Price Line or Candlestick
- Line charts show the stock’s closing price over time.
- Candlestick charts show the opening, closing, high, and low prices for a specific time period. They use colors (usually green and red) to indicate whether the stock price went up or down.
2. Volume
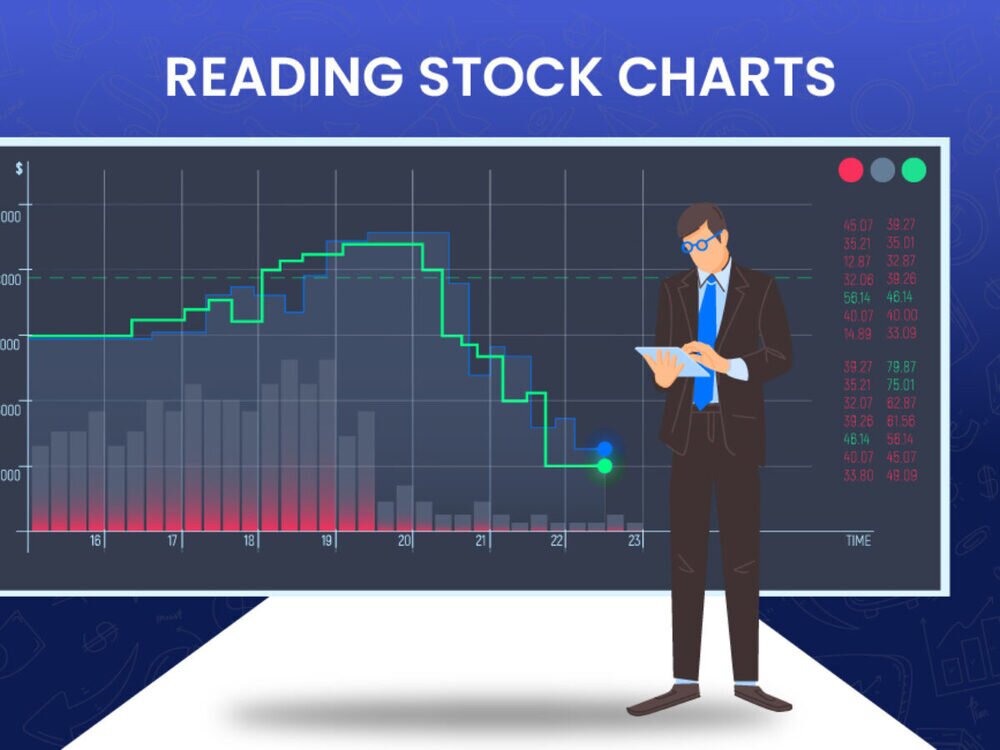
This is the number of shares traded in a day. It’s usually shown as a bar graph under the price chart. High volume often means strong interest in a stock.
3. Time Frame
Stock charts let you view price history in different time frames:
- 1 Day
- 5 Days
- 1 Month
- 6 Months
- 1 Year
- 5 Years
- Max (entire history)
Use different time frames to understand both short- and long-term trends.
4. Moving Averages
These are lines that smooth out price data to show average prices over a set period (e.g., 50-day or 200-day moving averages). They help identify the overall trend of a stock.
5. Support and Resistance Levels
- Support is a price level where a stock tends to stop falling.
- Resistance is where it tends to stop rising.
These levels help traders predict future price movements.
Basic Chart Patterns Every Beginner Should Know
1. Uptrend (Bullish Trend)
The stock price makes higher highs and higher lows. It’s gaining strength.
2. Downtrend (Bearish Trend)
The price shows lower highs and lower lows. It’s losing strength.
3. Sideways (Consolidation)
The stock price moves within a narrow range. It may be preparing for a breakout or breakdown.
4. Breakout
The price moves above resistance — a possible signal to buy.
5. Breakdown
The price falls below support — a possible signal to sell or wait.
Tools and Platforms to Use
Here are free tools that let you practice reading stock charts:
- TradingView (tradingview.com)
- Yahoo Finance (finance.yahoo.com)
- Google Finance
- Investing.com
Each platform offers interactive charts where you can apply indicators and analyze performance.
Tips to Read Charts Like a Pro
- Start with the bigger picture. Look at longer time frames before zooming in.
- Watch for volume spikes. They often confirm breakouts or breakdowns.
- Use simple indicators first. Start with moving averages and RSI (Relative Strength Index).
- Be consistent. Stick with a few stocks to observe regularly.
- Don’t rely only on charts. Combine technical analysis with fundamental research.
Conclusion
Reading stock market charts doesn’t have to be intimidating. With a little practice, you’ll start to spot trends, understand investor behavior, and make smarter decisions. Whether you’re trading daily or investing for the long term, mastering chart reading is a skill that pays off.
The market speaks through charts. Learn the language, and you gain a powerful edge.